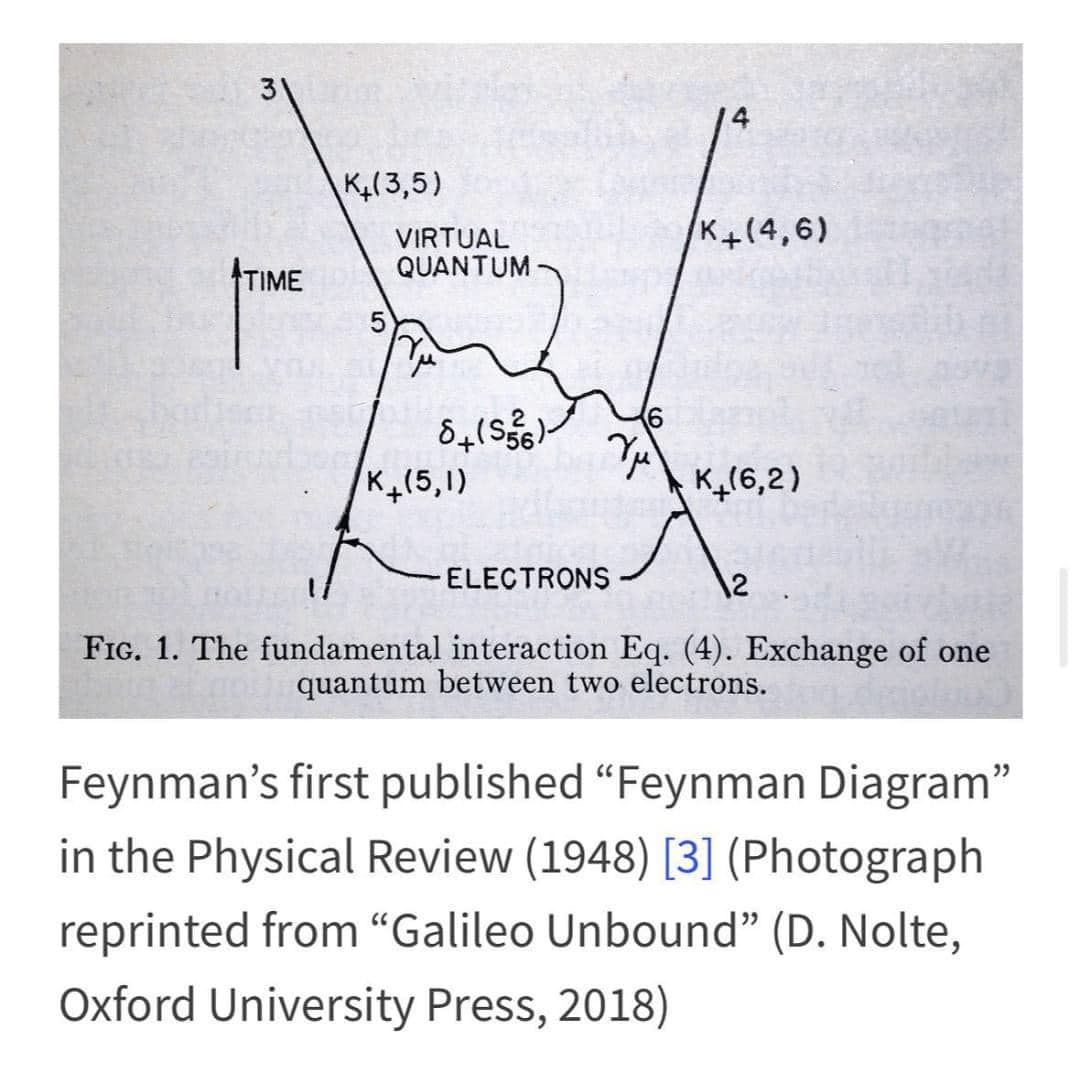
Feynman diagrams are a graphical representation of particle interactions in quantum field theory, developed by physicist Richard Feynman in the 1940s. They provide a visual tool for calculating probabilities of particle interactions and have become a cornerstone of particle physics.
Richard Feynman introduced diagrams in 1948 as a way to simplify complex calculations in quantum electrodynamics (QED). They were initially met with skepticism but eventually gained acceptance as a powerful tool in particle physics. Today, they are used in various areas of physics, including particle physics, condensed matter physics, and quantum computing.
Key Components:
- Vertices: Points where particles interact
- Propagators: Lines representing particles moving through space-time
- Feynman rules: Mathematical prescriptions for calculating probabilities from diagrams
Types of Feynman Diagrams:
- Tree-level diagrams: Simplest diagrams with no loops
- Loop diagrams: More complex diagrams with loops, representing virtual particles
- Renormalization: Process of removing infinite values from loop diagrams
Feynman diagrams have revolutionized particle physics by:
- Simplifying complex calculations
- Providing a visual representation of particle interactions
- Facilitating calculations of probabilities and amplitudes
See Also
Figure 7B.09 - Feynmans Triplet Structure of Photon
Feynman
Figure 4.14 - Feynmans Triplet Structures of the Proton and Neutron
16.18 - Magnetism - Feynman
